| Code | Name | Description |
|---|---|---|
| E | Estimate | Estimated by eye |
| C | Clinometer | Hand-held clinometer or Abney level |
| T | Tripod | Survey-grade equipment mounted on a tripod |
| D | DEM | Calculated from a DEM with suitable resolution and vertical accuracy |
10 Soil surface
A soil profile description is placed in its landform and landscape context using the system described in Section 9.3. The land surface is then described primarily in terms of its slope, aspect, and surface cover. If present, surface water and microrelief features should also be recorded. Ongoing or recent erosion and/or deposition events can be briefly noted or described in more detail.
10.1 Slope
Slope is the inclination of the land surface relative to the horizontal plane. Slope steepness affects many soil processes, notably erosion, water run-off, and infiltration behaviour.
Direct measurements of slope should be taken over a minimum distance of 20 m. Stand 10 m upslope from the point of observation and measure downhill along the steepest gradient that passes through the point of observation. Record slope in degrees, with a maximum precision of 0.1.
Record ND if slope cannot be reliably determined. Record NR if no measurement was taken. Ignore the influence of microrelief features smaller than the site extent while measuring slope (see Section 10.7.2; e.g. steep, short slopes from track cuttings).
The degree of precision needed will vary with slope and survey purpose; whole number degrees are sufficient on any slope over about 5 degrees, but finer gradations can be useful for flatter locations. Classification options for slope measurements are presented in Section D.1.1. Record the equipment used to measure slope using Table 10.1.
For example: use 5° E for an estimated 5 degree slope.
10.2 Aspect
Aspect is the direction a slope faces. Slope aspect helps determine exposure to sun, rain and prevailing winds, and so influences the biome growing in a particular soil. In some environments it also helps determine how much new material is received by deposition.
Aspect should be measured at the same time and over the same transect as slope. Record aspect in whole degrees clockwise from north, using the range 0–359° (360° = 0°). Use ND for flat ground (see Note 10.1). Use NR if no measurement was taken. Classification options for aspect measurements are presented in Section D.1.2. Record the equipment used to measure aspect using Table 10.2.
For example: use 135° C for a southeast-facing slope, recorded using a compass.
| Code | Name | Description |
|---|---|---|
| E | Estimate | Estimated by eye |
| C | Compass | Hand-held magnetic compass |
| D | DEM | Calculated from a DEM with suitable resolution and vertical accuracy |
10.3 Surface cover
Surface cover helps visualise the area around a profile description and provides some information on infiltration behaviour. Surface cover, specifically ‘the number of days in a year that the soil (agricultural land) is covered with vegetation’, is a key agricultural performance indicator (OECD 2001).
Estimate and record the generalised surface cover components as a percentage composition of the site (Section 9.1), using the codes in Table 10.3. Consider the surface cover from the surface to a height of 1.35 m, for consistency with Hurst et al. (2022). The lithology of surface rock fragments and/or outcrop can be recorded per Section 4.2. Surface rock cover can also be described in detail according to Section 12.2.1.
For example: use BE 10%, GR 90% for a pasture with near-complete ground coverage.
| Code | Name | Description |
|---|---|---|
| BE | Earth | Bare unconsolidated sediment or soil, <2 mm |
| BG | Small fragments | Rock fragments, shells, or bones, 2–200 mm |
| BB | Large fragments | Large rock fragments >200 mm |
| BR | Rock | Bare rock outcrop |
| WT | Water | Open water, ice or snow |
| PT | Peat | Plant material decomposing under saturated conditions |
| LI | Litter | Plant material decomposing under intermittently wet and dry conditions |
| GR | Small plants | Grasses, ferns, herbs, moss, sedges, annual crops |
| TR | Large plants | Shrubs, trees and treeferns (stems and roots), perennial crops |
| SL | Sealed | Building, concrete, asphalt and similar |
10.4 Surface disturbances
Disturbances have the potential to influence the soil as well as its cover. Noting these events can provide context for the parameters recorded, and some are especially useful when interpreting laboratory results. Table 10.4 provides a list of disturbance categories. Free-text notes can be used if additional detail is needed.
Only record recent events directly affecting the profile. ‘Recent’ is a relatively flexible concept which highlights the reasons some parameters observed might be locally unusual. Some of these events recur regularly (e.g. tillage) so only need to be recorded if the are very recent (e.g. the previous week).
If the time since the event is uncertain, record an estimate using one of the options in Table 10.5.
For example: use FL S for a flood estimated to have occurred within the past 6 months.
If the time since the event is known with high certainty, record days since the event.
For example: use FL 10 for a well-documented recent flood.
| Code | Name |
|---|---|
| MC | Mechanical disturbance (e.g. tillage, deep ripping, subsoiling, recontouring) |
| AN | Animal disturbance (e.g. pugging, rooting, tunnelling, excretion) |
| CL | Complete vegetation clearance by humans (e.g. clearfelling, harvest) |
| CO | Selective vegetation clearance by humans (e.g. tree removal or weed clearance) |
| WI | Wind-induced treefall |
| SL | Natural erosion event – material lost from site |
| SD | Natural deposition event – material added to site |
| FC | Fire – controlled burn |
| FW | Fire – uncontrolled burn |
| FL | Flooding – freshwater |
| FS | Flooding – saline water (e.g. storm surge event) |
| PO | Pollution event (e.g. petrol spill) |
| NO | No recent events |
| UK | Unknown |
| Code | Name |
|---|---|
| D | Within the past day |
| W | Within the past week |
| M | Within the past month |
| S | Within the past 6 months |
| Y | Within the past year |
10.5 Surface water
Information about surface water can contribute to drainage assessments. If surface water is present at the site, record its presence and estimate the area covered using the WT code in Section 10.3. Optionally, append type and degree of persistence using the codes in Table 10.6 and Table 10.7.
For example: use WT 20% (R, T) for a paddock experiencing limited surface ponding from a recent cyclone at the time of observation.
| Code | Name | Description |
|---|---|---|
| M | Saline surface water | Marine, estuarine, or inland-saline waters flowing over the surface |
| F | Fresh surface water | Palustrine, lacustrine or riverine waters flowing over the surface |
| C | Cold groundwater | Waters rising to the surface from cold springs or an elevated natural water-table |
| G | Hot groundwater | Waters rising to the surface from geothermal sources (temperature 30°C or more) |
| S | Snow | Snow falling on or near the site and accumulating on the surface |
| R | Rainfall | Rain falling on or near the site and accumulating on the surface |
| A | Anthropic | Water from a man-made discharge location or backing up behind a dam |
| N | None | Surface free from ponds or puddles |
| Source: adapted from IUSS Working Group WRB (2022) and Johnson and Gerbeaux (2004). | ||
| Code | Name | Description |
|---|---|---|
| P | Permanent | Surface water persists year-round |
| S | Seasonal | Surface water is present during wet seasons |
| T | Temporary | Surface water is present due to a specific event |
| Source: adapted from IUSS Working Group WRB (2022). | ||
10.6 Surface cracking
Soil surface cracking can occur for a number of reasons, including the following:
- The soil parent material includes shrink–swell clays, in an environment that allows desiccation.
- Sediment was originally deposited underwater (e.g. during a flood) and cracks on drying out.
- Freeze–thaw cycles, mass movement, or tectonic activity has caused surface deformation.
Surface cracks can have a strong influence on infiltration behaviour. Surface cracks are not strongly related to soil structure, generally being much larger than the spaces between peds and often extending through more than one horizon. However, cracks are more likely to form and re-form along existing planes of weakness.
Within the site, record surface crack presence/persistence using the codes in Table 10.8. If present, record spatial arrangement using the codes in Table 10.9, as well as median width, depth, and spacing between cracks in centimetres. Note that infilled cracks should be described as per Section 11.5.
For example: use RT P 0.5 cm, 10 cm, 35 cm for surface cracking patterns common to Vertic Melanic Soils.
| Code | Name | Description |
|---|---|---|
| NO | None | No surface cracks |
| RT | Reversible cracks | Cracks that open and close with changing soil moisture |
| IT | Irreversible cracks | Cracks that persist year-round |
| Source: (IUSS Working Group WRB 2022). | ||
| Code | Name | Description |
|---|---|---|
| P | Polygonal | Surface cracks forming closed shapes on the land surface |
| L | Linear | Surface cracks running roughly parallel to one another |
| I | Irregular | Surface cracks with no discernible pattern |
| Source: (IUSS Working Group WRB 2022). | ||
Recent weather data are useful for interpreting surface crack information (Section 5.2.2).
10.7 Microrelief
‘Microrelief’ is a term covering small-scale, regular or semi-regular repeating patterns of surface deformation. Microrelief occurs within a landform, so its components are smaller than the landform itself – often too small to be reliably sensed remotely.
Consider the following example of how microrelief fits into a particular landscape context. In a hill-country landscape a north-facing slope landform is used for sheep grazing. Over time, stock movement has created small, step-like terraces on the slope surface. The terraces, known as terracettes, are a form of biotic microrelief. They are 20–30 cm high and spaced 1–2 m apart. While the terracettes do not alter the overall form of the slope, they influence local surface water movement and erosion.
Microrelief presence and character can help signify particular soil types, and also influence many small-scale soil processes such as local water infiltration, accumulation of surface litter, and topsoil development.
10.7.1 Natural microrelief
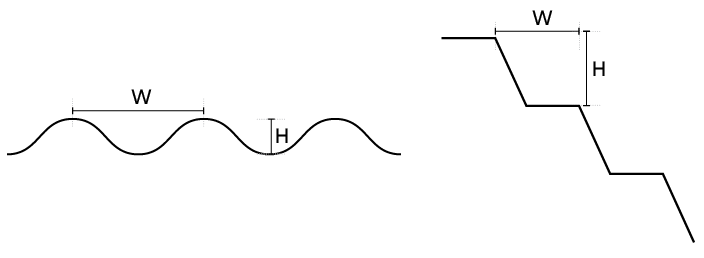
Natural microrelief emerges from a similar set of drivers to soil formation itself. Record the dominant microrelief driver and form using the codes in Table 10.10 and Table 10.11. In practice the type categories can overlap and interact, but a dominant force should usually be apparent. Optionally, record the average height and spacing of repeating microrelief elements in centimetres.
Where the microrelief pattern is larger than the profile being examined, note the location of the profile relative to the pattern (e.g. whether a core has been drilled in a dip).
| Code | Name | Description |
|---|---|---|
| N | None | Site surface is naturally smooth or level |
| G | Soil | Induced by shrink–swell clay activity (e.g. gilgai) |
| B | Biotic | Induced by plant or animal activity (e.g. forest dimples from treethrow) |
| C | Climatic | Induced by temperature extremes or wind and water (e.g. frost heave, sand ripples) |
| T | Terrain | Induced by mass movement effects on slopes |
| S | Substrate | Induced by changes to the substrate (e.g. small karst features) |
| A | Anthropogenic | Induced by deliberate human activity |
| Source: adapted from the Australian Soil and Land Survey Field Handbook and IUSS Working Group WRB (2022). | ||
| Code | Name | Description |
|---|---|---|
| R | Ripples | Small elongate rises above a planar surface |
| H | Hummocks | Small rounded rises above a planar surface |
| D | Dips | Small hollows set into a planar surface or slope |
| U | Undulating | A pattern of alternating small hummocks and dips |
| T | Terracettes | Small shelves or steps on a larger slope |
10.7.2 Anthropogenic microrelief
Small-scale human alterations to the soil surface are common in agricultural and urban areas (both current and former). Microrelief can be both removed from and created by these activities.
If the alteration is relatively recent, a surface disturbance code (e.g. MC) from Table 10.4 can be used. Otherwise, record the dominant anthropogenic microrelief type using the codes in Table 10.12. The driver (Table 10.10) in all cases will be A. For detailed descriptions of anthropogenic microrelief, record the average height and spacing of repeating elements in centimetres.
| Code | Name | Description |
|---|---|---|
| C | Smoothed | Site surface has been smoothed, contoured, rock-picked, infilled or levelled, beyond normal tillage effects |
| B | Raised beds | Elevated areas have been created and maintained for specific crops; e.g. rows for vegetables or puke (mounds) for kūmara |
| H | Hump and hollow | Broad, alternating surface drains and ridges constructed across a surface, usually for pasture production |
| R | Terraces and tracks | Hillsides have been cut/filled into small terraces, or tracks cut in across the slope |
| D | Drained | Open drainage ditches have been cut into the surface |
| Source: adapted from the Australian Soil and Land Survey Field Handbook and IUSS Working Group WRB (2022). | ||
10.8 Erosion and deposition
Erosion and deposition processes operate at the landscape and landform scale and have effects on the site and profile description. When documenting erosion and deposition across landforms and landscapes, the LUC erosion assessment framework should be applied (Lynn et al. 2009). At the site scale (radius up to ~10 m, see Section 9.1), the system below allows description of the localised nature and impact of these processes.
10.8.1 Erosion
Where there are active signs of erosion, its presence can be recorded using the profile disturbance code SL (see Section 10.4). If a more detailed assessment is desired, record using the type(s) given in Table 10.13. If erosion is present, also record severity and activity using Table 10.14 and Table 10.15. Only record erosion directly affecting the profile.
For example: use RI S PR for rills observed on a tilled paddock after a storm, or NO - - for an unaffected area.
| Code | Name | Description |
|---|---|---|
| Water-driven | ||
| SH | Sheet | Thin layers of surface material are gradually removed more or less evenly from an extensive area of sloping land |
| RI | Rill | Formation of predominantly steep-sided erosion channel(s) ≤0.5 m deep. |
| GU | Gully | Formation of predominantly steep-sided erosion channel(s) >0.5 m deep, not capable of being safely crossed by a wheeled tractor or obliterated by ploughing or deep cultivation |
| TN | Tunnel | Erosion by percolating water in a layer of subsoil, resulting in caving in and the formation of tunnels through which soil material is removed. Includes the linear dips and sinkhole features created by tunnel collapse |
| CH | Channel | Erosion by water flowing in stream and river channels, including stream bank erosion |
| Gravity-driven | ||
| FA | Fall | A very rapid downward movement of a mass of rock or earth that travels mostly through the air by free fall, leaping, bounding or rolling, with little or no interaction between one moving unit and another (e.g., rock-fall, debris fall) |
| TO | Topple | Large blocks of earth material or rocks falling forward off a very steep to precipitous slope |
| SL | Slide | Lateral displacement of earth materials moving as a block along a deep-seated slip face, either rotational (‘slump’) or translational |
| SP | Spread | Rapid displacement of wet, plastic materials that liquefy, often bringing along intact blocks or beds |
| FW | Flow | Moderate to rapid movement of earth materials that behave as a viscous fluid (earthflow or mudslide) |
| CR | Creep | Slow, gradual movement of earth materials down a slope |
| Wind-driven | ||
| WI | Wind | Detachment, transport, and deposition of loose materials by wind action, especially where a vegetation cover is not present. |
| Other | ||
| UK | Unknown | Mode of erosion cannot be clearly determined |
| NR | Not recorded | Mode of erosion not recorded |
| NO | No erosion | No evidence of erosion |
| Code | Name | Description |
|---|---|---|
| S | Slight | Some evidence of damage to surface layers; original ecological functions largely intact |
| M | Moderate | Clear evidence of removal of surface layers; original ecological functions partly destroyed |
| V | Severe | Surface layers completely removed and subsurface layers exposed; original ecological functions largely destroyed |
| E | Extreme | Substantial removal of deeper subsurface layers; original ecological functions fully destroyed |
| Source: IUSS Working Group WRB (2022). | ||
| Code | Name | Description |
|---|---|---|
| PR | Active | Active at present |
| FR | Fresh | Active within the past year |
| RE | Recent | Active within the past 100 years |
| HI | Historical | Active in historical times (>100 years ago) |
| UK | Unknown | Activity history cannot be reliably determined |
| Source: adapted from IUSS Working Group WRB (2022). | ||
10.8.2 Deposition
Where there are signs of deposition, its presence can be recorded using the profile disturbance code SD (see Section 10.4). If a more detailed assessment is desired, record using the type(s) given in Table 10.16. If deposition is present, also record severity and activity using Table 10.17 and Table 10.15. Only record deposition directly affecting the profile.
For example: use FL M FR for a recent flood that has dropped sediment on a low terrace and partly smothered grass, or NO - - for an unaffected area.
| Code | Name | Description |
|---|---|---|
| Water-driven | ||
| FL | Flood | Deposition driven by inundation events along streams |
| SS | Surge | Deposition driven by storm surge |
| TI | Till | Glacial deposition |
| Gravity-driven | ||
| FA | Fall | Rapid, freefall collapse of earth material on precipitous slopes |
| TO | Topple | Large blocks of earth material falling forward off very steep to precipitous slope |
| SL | Slide | Lateral displacement of earth materials moving as a block along a deep-seated slip face, either rotational (‘slump’) or translational |
| SP | Spread | Rapid displacement of wet, plastic materials that liquefy, often bringing along intact blocks or beds |
| FW | Flow | Slow to rapid movement of earth materials that behave as a viscous fluid (earthflow or mudslide) |
| CR | Creep | Slow, gradual movement of earth materials down a slope |
| Wind-driven | ||
| VR | Volcanic eruption | Deposition from pyroclastic fall or flow materials (tephra) from explosive volcanic eruptions |
| SA | Sand movement | Wind-driven deposition of sand (e.g., from beaches, banks, or remobilised dunes) |
| SI | Silt movement | Wind-driven deposition of silt and finer material (e.g., from banks or bare earth) |
| Other | ||
| UK | Unknown | Mode of deposition cannot be clearly determined |
| NR | Not recorded | Mode of deposition not recorded |
| NO | No deposition | No evidence of deposition |
| Source: partly adapted from the *Australian Soil and Land Survey FIeld Handbook. | ||
| Code | Name | Description |
|---|---|---|
| S | Slight | Patchy or thin cover over previous surface layers; original ecological functions largely intact |
| M | Moderate | Cover mostly complete but <10 cm thick; original ecological functions partly destroyed |
| V | Severe | Cover complete and >10 cm thick; original ecological functions largely destroyed |
| E | Extreme | Cover complete and permanent; original ecological functions fully destroyed |
More detailed assessments of local erosion and deposition are possible using the characterisation principles in Turner and Schuster (1996), but they are considered beyond the scope of a soil profile description.