| Mean Summer Temp. (°C) | Annual Rainfall ≥4x Evapotranspiration | Annual Rainfall <4x Evapotranspiration | Annual Water deficit >270 mm |
|---|---|---|---|
| >22.5 | Subtropical, humid | Subtropical, subhumid | Subtropical, semi-arid |
| >17–≤22.5 | Warm, humid | Warm, subhumid | Warm, semi-arid |
| >15–≤17 | Mild, humid | Mild, subhumid | Mild, semi-arid |
| >12.5–≤15 | Cool, humid | Cool, subhumid | Cool, semi-arid |
| >10–≤12.5 | Cold, humid | Cold, subhumid | Cold, semi-arid |
| >5–≤10 | Low-alpine, humid | Low-alpine, subhumid | Low-alpine, semi-arid |
| <5 | High-alpine, humid | High-alpine, subhumid | High-alpine, semi-arid |
5 Climate and weather
5.1 Climate
Climate parameters affect soil development directly (e.g. freeze-thaw cycles, erosive rainfall) and indirectly (e.g. by their influence on vegetation community composition and structure). This section outlines how climate is measured and described, and highlights data sources relevant to New Zealand soils.
Climate parameters are not recorded in the field as they are constructed from time series data and cannot be observed during a soil profile description.
5.1.1 Global
A comprehensive national-scale account of New Zealand’s climate can be found in Macara (2018).
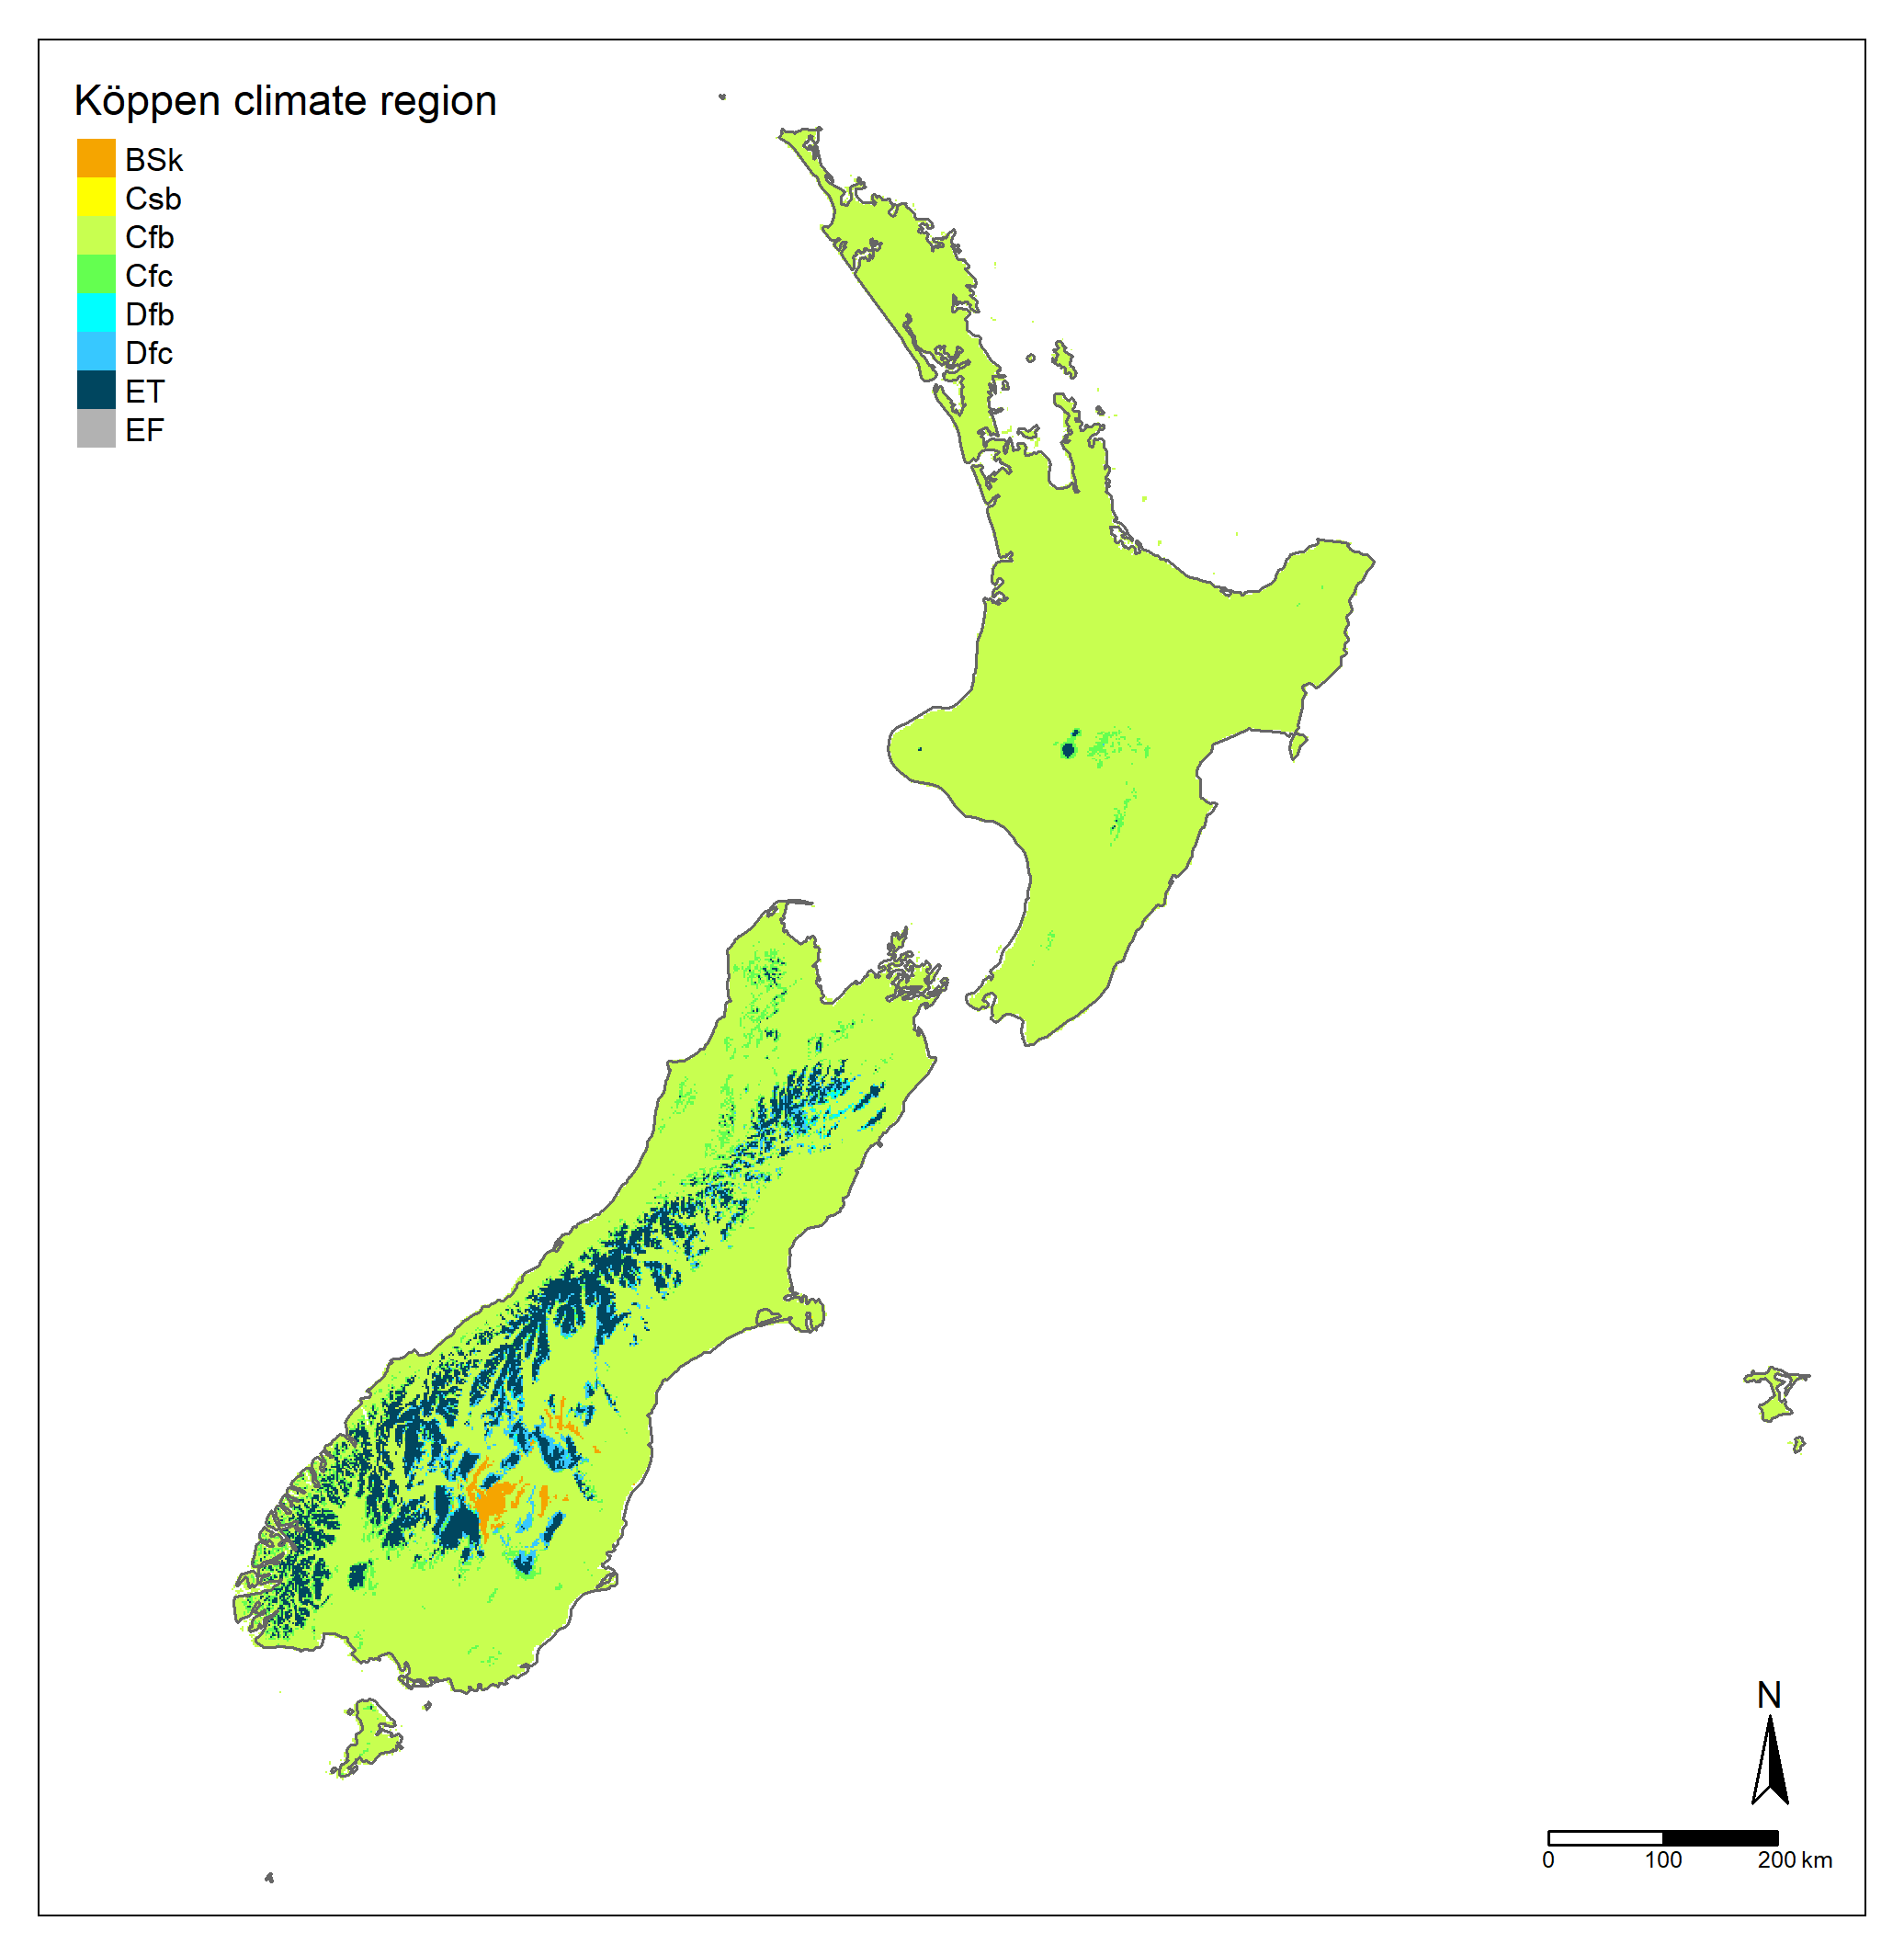
The Köppen-Geiger climate classification (Köppen 1936) is the most well-known and accepted global system for summarising climate information, and has been periodically updated (e.g. Kottek et al. 2006; Beck et al. 2018; Beck et al. 2023). Current maps and projections under various climate change scenarios are available from https://www.gloh2o.org/koppen/.
In New Zealand, the Köppen regions that currently occur can be seen in Figure 5.1.
5.1.2 Regional
Regional climate classifications are particularly useful when developing an understanding of an area new to the surveyor, and when comparing data from disparate environments. Various climate classifications specific to New Zealand have been produced in the past (e.g., Robertson 1956; Garr and Fitzharris 1991; Sturman et al. 1999), with the most widely known to New Zealand soil scientists being the classification embedded in the Land Environments of New Zealand (LENZ, see Leathwick et al. 2002; Leathwick et al. 2003).
More recently, Singers and Rogers (2014) defined a set of regional macroclimates with reference to mean summer temperature and the ratio of rainfall to potential evapotranspiration. Table 5.1 outlines their macroclimate classification limits. For routine recording, the regional macroclimate may be estimated using Table 5.1. For detailed recording, it should be determined from best available data. This does not have to be done in the field.
NIWA (now part of Earth Sciences New Zealand) have more recently published a set of Regional Climatologies, aligned to each of New Zealand’s regional council boundaries. These do not comprise a true regional classification, but they contain consistent reporting of prevailing conditions within each regional council area, including discussion of within-region variability.
5.1.3 Local
Earth Sciences New Zealand publish short and long-term climate data statistics for over 1200 specific recording stations (Earth Sciences New Zealand 2025a; Earth Sciences New Zealand 2025b). Local records of climatic conditions are also commonly kept by individual landholders, and should be sought out as needed.
5.1.4 Key parameters
Some climatic parameters are more directly related to soils than others, mainly through their influence on vegetation community and evapotranspiration. The following subsections comprise a brief discussion of commonly available climate parameters as they pertain to soil occurrence and development in New Zealand.
Spatial estimates of many of the parameters described below were made at 100 m resolution for LENZ and have been republished in the New Zealand Environmental Data Stack (McCarthy et al. 2021). However, these maps were based on a relatively small set of observations that covered the period 1950-1980, so their utility is limited (Srinivasan et al. 2024). Newer versions of these datasets covering the period 1991-2020 are available from Earth Sciences New Zealand (Earth Sciences New Zealand 2025c), although their spatial resolution is lower, at 500 m. Summary figures from specific recording stations are available from the NIWA regional climatology documents discussed in Section 5.1.2.
5.1.4.1 Rainfall
Soil moisture availability strongly influences chemical weathering in soils (Dixon et al. 2016), and in many parts of the landscape the main source of soil moisture is rainfall.
- Total annual rainfall: some soils are unlikely to form outside a particular total annual rainfall range, e.g. Allophanic Soils are uncommon where total annual rainfall is less than 1000 mm (Hewitt and MWLR Pedology Staff, 2025).
- Rainfall seasonality: calculated as the mean of monthly rainfall totals, divided by their standard deviation. More pronounced seasonality implies stronger soil wetting and drying cycles, which in turn influences weathering processes. An alternate measurement of seasonality involves calculating the ratio of rainfall in the warmest versus the coolest three months. In New Zealand this is usually (December+ January + February)/(June + July + August).
5.1.4.2 Temperature
- Soil temperature: soil temperatures vary from atmospheric temperatures, changing more slowly and also varying by depth. Land cover and geothermal heat sources can also affect soil temperature. While not a key feature of the New Zealand soil classification (Hewitt and MWLR Pedology Staff, 2025), other systems like Soil Taxonomy (Soil Survey Staff 2022) require knowledge of the soil temperature regime.
- Mean annual temperature: the mean atmospheric temperature recorded year-round. Relevant for agricultural suitability assessments.
- Mean summer temperature: the mean temperature recorded over the warmest quarter of the year. In New Zealand, this is usually December-January-February. Mean summer temperature was a key parameter used by Singers and Rogers (2014) to classify NZ terrestrial ecosystems.
- Growing Degree Days (GDD): GDD measures the total number of degrees Celsius above a set minimum temperature (usually 5, 10, or 16°C). Average daily temperature (maximum + minimum/2) is used in the calculation, and where temperature is below the set minimum, 0 is recorded. Plant species have specific GDD requirements that help determine their distribution and preferred growing conditions.
- Frost Days (FD): frost days are days where the temperature drops below 0 °C, measured 1.2 m above the land surface. Many plant species are vulnerable to frost, particularly as juveniles.
5.1.4.3 Water balance
Data on evapotranspiration rate, relative humidity, and soil moisture deficit (or excess) are relevant to ecological studies and agricultural suitability assessments. Only soil moisture deficit may directly relate to soil profile characteristics (e.g. drainage behaviour) but available data is too low-resolution to be applied at individual sites.
5.1.4.4 Light
The amount of solar energy received by a site, modified by terrain, day length and cloud cover, can strongly affect plant growth, evapotranspiration, and soil weathering rates. Incoming solar radiation, total annual and monthly sunshine hour data surfaces are available from Earth Sciences New Zealand (2025c), and theoretical maximums under fine weather conditions can be calculated in GIS software with the aid of a digital elevation model.
5.1.4.5 Wind
The prevailing wind direction, its usual strength and seasonality all affect evapotranspiration rates and even the physical development of growing plants. Prevailing wind can also influence aeolian sediment supply (loess or sand) and depositional or erosional pattern. Particularly when conducting agricultural suitability assessments, it may be important to note the most common directions of prevailing winds, their strength, seasonality and the degree to which each landform assessed is sheltered. Wind shelter can be interpreted from measurements of exposure (Section 3.4.2) and landform orientation (Section 3.3.2.2) in relation to prevailing wind direction.
5.2 Weather
Although contemporary weather conditions usually have little influence on soil formation, except in young or rapidly developing soils, they remain relevant for agricultural suitability assessment and for interpreting soil profile descriptions in the context of site conditions at the time of observation. Information about recent New Zealand weather conditions can be found on the NIWA website at https://niwa.co.nz/climate-and-weather/daily-climate-maps. Recording weather conditions during a soil profile description is optional but useful for later interpretation of the profile data.
5.2.1 Current weather
Weather at the time of observation can be recorded using the codes in Table 5.2.
| Code | Name |
|---|---|
| SU | Sunny |
| PC | Partly cloudy |
| OV | Overcast |
| RA | Rain |
| SL | Sleet |
| SN | Snow |
5.2.2 Recent rainfall
Recent rainfall at the time of observation can be recorded using the codes in Table 5.3. Knowing about recent rainfall can provide valuable context when recording surface cover (Section 10.3), the presence of surface water at a site (Section 10.5), detailed erosion/deposition descriptions (Section 10.8.1, Section 10.8.2) and soil moisture status (Section 11.6). Heavy rain is defined as rainfall >100 mm in 24 hours. Excessive rainfall is less strictly defined, but will generally exceed 100 mm in only a few hours.
| Code | Name |
|---|---|
| NM | No rain in the last month |
| NW | No rain in the last week |
| ND | No rain in the last 24 hours |
| RD | Rain but no heavy rain in the last 24 hours |
| RH | Heavy rain for some days or excessive rain in the last 24 hours |
| RE | Extremely rainy or snow melting |
| UK | Unknown/uncertain |