| Code | Name | Description |
|---|---|---|
| R | Redox mottles | Colour patterns induced by redox processes |
| W | Weathering | Colour patterns induced by development of weathering features e.g. coatings |
| L | Leaching | Colour patterns induced by effects of leaching e.g. pale veins |
| X | Mixing | Colour patterns induced by biological (e.g. worm tunnels) or mechanical (e.g. landslide) means |
13 Colour
13.1 Colour recording
The colour of soil components is recorded using the Munsell Soil Colour system (Munsell Color Company 2009; Pantone 2017), which conceptualises colour using Hue, Value and Chroma parameters. Table 13.1 shows some example soil colours and their representation in the Munsell system as well as their approximate translations into other colour spaces. A comprehensive primer on colour and its application in soil science can be found in Bigham and Ciolkosz (1993).
| Munsell | RGB | Hex | Colour |
|---|---|---|---|
| 10YR 5/4 | 148, 118, 80 | #947650 | |
| 7.5YR 3/2 | 88, 69, 55 | #584537 | |
| 5R 3/8 | 130, 41, 48 | #822930 | |
| N 4/0 | 97, 97, 97 | #616161 |
For accurately describing colour:
- The colour charts must be used in clear direct or non-dappled indirect daylight. Avoid describing colours in the early morning, late afternoon, in dappled light or in deep shade. Avoid using damaged or faded colour books.
- Record the moist colour to standardise the readings across profiles. Use a spray bottle to gently wet up a sample, if necessary, or wait for a saturated sample to dry out slightly. In both cases wait until the sample surface is no longer glistening.
- Remove sunglasses and turn to keep the main light source behind your shoulder.
- The sample may not perfectly match any one chip; record the closest match available. Do not interpolate between chips.
13.2 Matrix colour
The matrix colour of the soil is the dominant ‘background’ colour. This excludes the colours of redox-induced mottles.
13.2.1 Method: Determining matrix colour
- Take a 2–3 cm3 sample of fresh soil from the target horizon, avoiding colour transition zones (e.g. horizon boundaries). If large enough peds are available, extract a ped and break it open to expose a fresh face. Otherwise, cut or scoop a fresh sample from the soil mass.
- Moisten the sample lightly before assessing the colour, by holding the sample up against the chips in the colour book. Hold the sample just in front of a colour chip for comparison. Look for a colour where the sample appears to fade into the chip.
- Do not record the colour of a texture bolus or a smeared surface, as these can be altered by mixing in mottles or destroying ped surface features.
- For sands, which may have differently-coloured grains from multiple parent materials, colour matching can be difficult. Try to pick the colour of the dominant mineral component. Holding the sample out at arms’ length may also help determine a dominant colour.
Additional colour information can be stored as free-text notes.
13.2.2 Recording matrix colour
For routine assessment, record the single dominant matrix colour per horizon. For detailed assessment, up to three matrix colours may be recorded if necessary. It is assumed that multiple matrix colours are co-dominant, otherwise the subdominant ones must logically be recorded as colour patterns (Section 13.3).
Dry soil matrix colours are sometimes necessary as well, e.g. for diagnosing a bleached E horizon. If moist and dry matrix colours are both obtained for a horizon, append them with their moisture status as D or M.
Example: 10YR52 M / 10YR71 D.
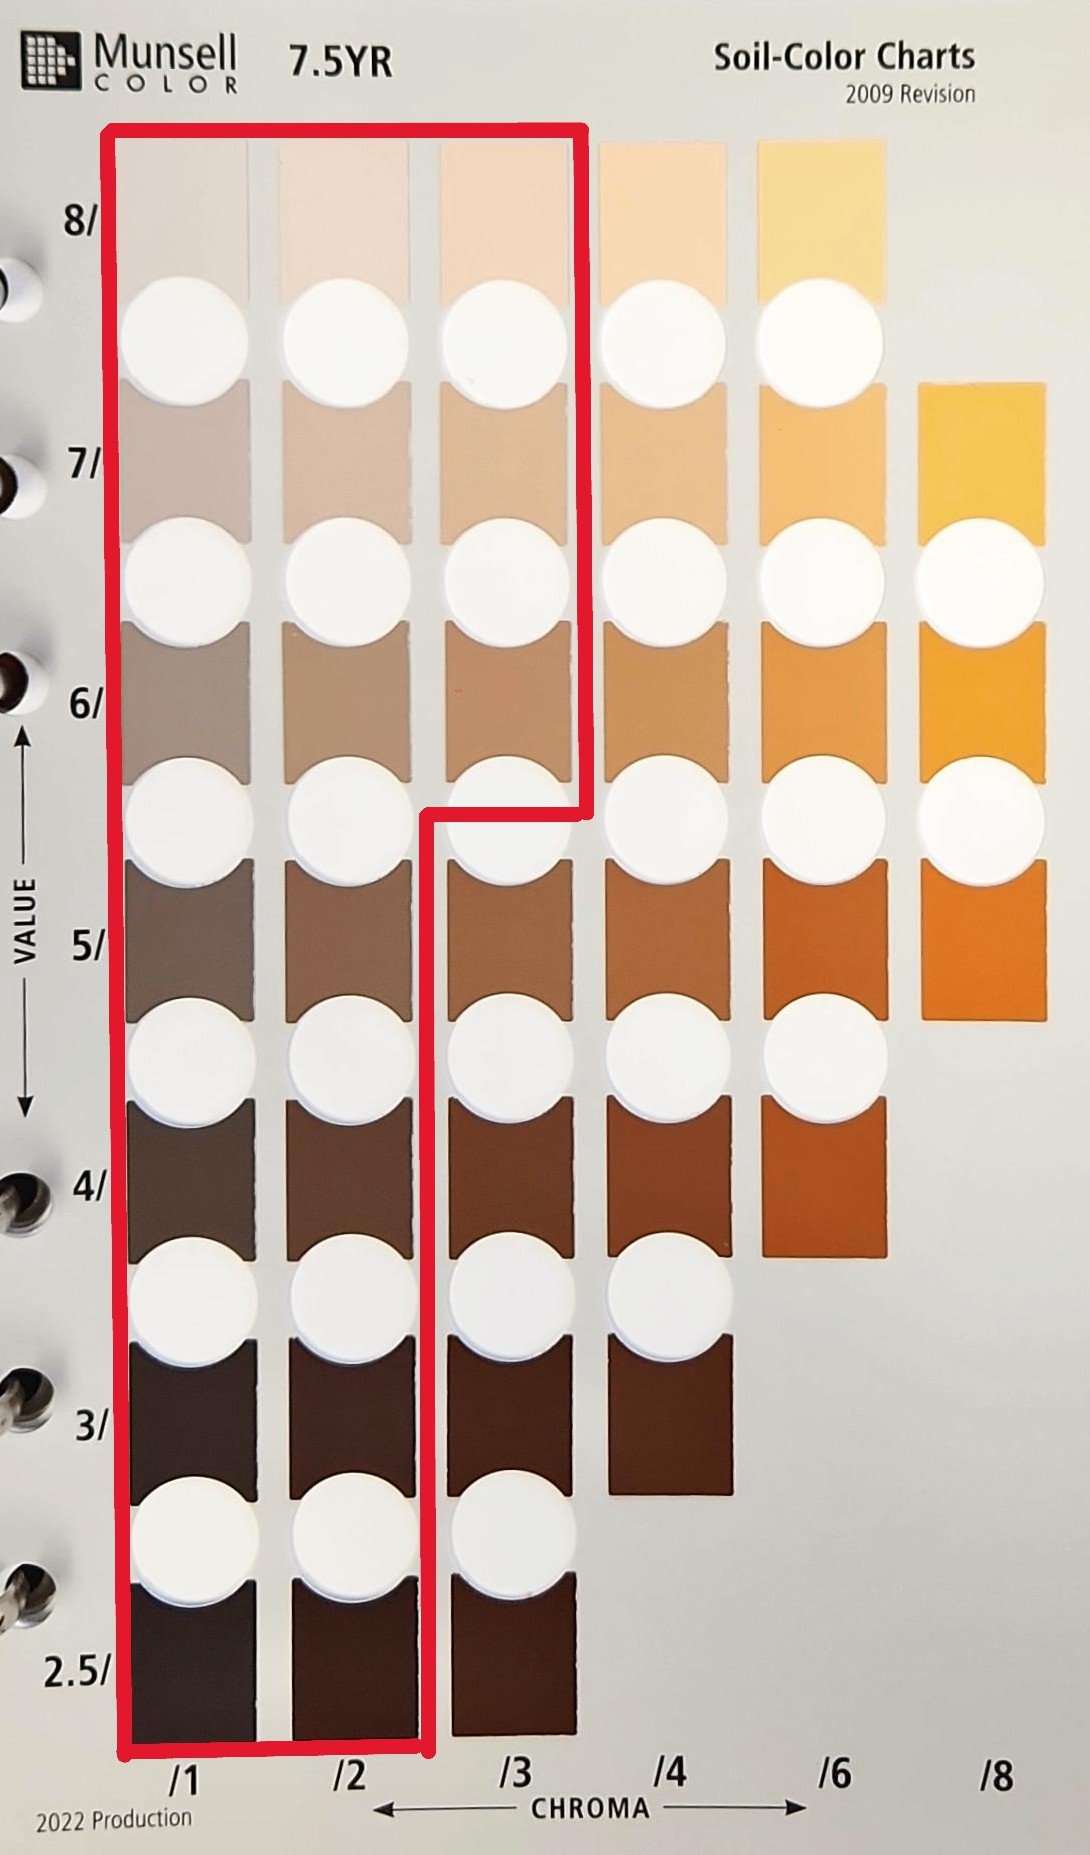
Note 13.2: Low-chroma colours
Naming soil horizons and classifying soils according to the NZSC requires, in many cases, the ability to identify ‘low chroma colours’. These colours have:
- a moist chroma of ≤2, or
- a moist chroma of 3 and a value ≥6.
Visually, the red outline in Figure 13.1 contains the low chroma colours. These are in the same location on any given page in the Munsell colour book. Additionally, all of the colours on the Gley and White pages qualify as low chroma.
13.3 Colour patterns
For most assessments, only pattern type (Section 13.3.1) and abundance ( Section 13.3.2) are required in addition to the pattern colour itself. Further detail is optional, but descriptive measures for pattern shape, size and distinctness are provided below.
13.3.1 Pattern type
Soil colour patterns are most commonly driven by redox processes affecting iron and/or manganese-dominated minerals, but can also be a product of parent material weathering, water movement, or mixing. Record pattern type using the codes in Table 13.2.
13.3.2 Pattern abundance
Estimate the areal percentage of the cut exposure face occupied by the colour pattern, versus the matrix colour. Use the visual guides in Section E.2.2.3 to help estimate accurately. Abundance data can be classified according to Table E.8 where needed.
For example, M 7.5YR58 25% for a bright orange redox mottle observed in moist soil conditions.
13.3.3 Pattern shape
Record pattern shape using the codes in Table 13.3.
| Code | Name | Description |
|---|---|---|
| B | Blotches | Rounded shapes, blobs, where colour patterns penetrate the soil mass |
| S | Stripes | Linear colour patterns e.g. root linings |
| C | Coatings | Patterns caused by ped surface features e.g. cutans |
13.3.4 Pattern size
Estimate the average size of each pattern in mm, e.g. 5 ± 2 mm. Pattern size may be classified against Section E.2.1.1 if necessary.
13.3.5 Pattern contrast
Rules for determining contrast in the field are defined in Table 13.4. If both matrix and pattern colours are recorded using the Munsell system, contrast can be calculated automatically. Complete rules for automating this process are found in Soil Survey Staff (2024), section 2–15.
| Code | Name | Description |
|---|---|---|
| F | Faint | Indistinct colour variation evident only on close examination. The secondary colour is typically of the same hue as the primary colour and will generally differ by no more than one unit of chroma or two units of value. |
| D | Distinct | Although not striking, the colour variation is readily seen. The secondary and primary colours usually:
|
| P | Prominent | The colour variation is conspicuous. The secondary and primary colours normally differ by
|
13.3.6 Pattern boundary distinctness
Record pattern boundary distinctness using the codes in Table 13.5.
| Code | Name | Description |
|---|---|---|
| S | Sharp | Knife-edge boundaries between colours. |
| C | Clear | Colour transition <2 mm wide |
| D | Diffuse | Colour transition >2 mm wide |
13.3.7 Colour short codes
For rapid recording of pattern colour, the single letter codes in Table 13.6 can be used.
For example, M O 25% for a bright orange redox mottle observed in moist soil conditions.
| Code | Name | Description |
|---|---|---|
| R | Red | 2.5YR or redder, with value <7 and chroma >2 |
| O | Orange | 5YR or 7.5YR, with value <7 and chroma >2 |
| B | Brown | 7.5YR or 10YR, with value >4 and chroma >2 |
| Y | Yellow | 2.5Y or 5Y, with value >4 and chroma >2 |
| G | Grey | Any non-gley hue, value 4–7, chroma 1 |
| D | Dark | Any non-gley hue, values ≤3 and chromas ≤2 |
| P | Pale | Any non-gley hue, values ≥7 and chromas ≤2 |
| L | Gley | Gley charts |