| Code | Name | Horizon Names | Typical Moisture | Common features |
|---|---|---|---|---|
| v | Intensely anaerobic | O*, *r | Saturated or wet | Redox mottling usually absent. Often deformable and/or fluid. May smell sulfureous |
| p | Strongly anaerobic | *g | Wet | Redox mottles more often on ped surfaces than interiors. Topsoils may have peaty-mineral textures |
| i | Moderately anaerobic | *(g) | Wet to Moist | Often strongest profile expression of redox segregations |
| m | Slightly anaerobic | *(f) | Wet to Dry | Redox mottles more often in ped interiors, otherwise often faint and small |
| w | Aerobic | No redox suffixes | Moist to Dry | Often friable or very friable |
19 Profile behaviour
Soil profile descriptions can be used to identify behavioural characteristics of a soil that are relevant to ecosystem composition and agricultural productivity.
19.1 Drainage
Soil drainage refers to the ability of water to move through the soil profile (internal drainage) as well as the amount of water the soil receives from surface or underground sources and how rapidly that water can leave (external drainage).
Internal drainage is partly determined by soil permeability (see Section 19.2), which in turn depends on structure, texture, and consistence. External drainage includes both drainage to greater depth or downslope and upward loss through evapotranspiration, so is determined by profile position in the landscape, adjacent soil and rock, the depth and nature of the subsolum, vegetation cover, and local climate. Land management practices will also affect the drainage regime.
19.1.1 Classifying drainage
The profile drainage classification defined in this handbook was originally developed for the New Zealand Soil Classification. The classes are relatively simple, based on the intensity of reduction observed within a given distance of the soil surface. Horizons are assessed for their reduction intensity using the rules in Table 19.1 (along with the guidance in Section 19.1.3 and Section 19.1.4), and then profile drainage is determined using Table 19.2.
For example: use MW for a soil profile with the sequence Ap (0–25 cm) over Bw(f) (25–45 cm) over B(g) (45–75 cm) over Bg (75–95 cm).
| Code | Name | Description |
|---|---|---|
| VP | Very poor |
Profiles with an intensely anaerobic horizon starting <30 cm from the soil surface; and
all horizons above 30 cm are at least strongly anerobic. |
| PO | Poor | Profiles with a strongly anaerobic horizon starting <30 cm from the soil surface |
| IP | Imperfect |
Profiles with a strongly or intensely anaerobic horizon starting 30 to <60 cm from the soil surface, or
profiles with a moderately anaerobic horizon starting <30 cm from the soil surface |
| MW | Moderately well |
Profiles with a slightly anaerobic horizon starting <90 cm from the soil surface, or
profiles with a moderately anaerobic horizon starting 30 to <90 cm from the soil surface, or profiles with a strongly or intensely anaerobic horizon starting 60 to <90 cm from the soil surface |
| WE | Well | No reduction is evident in any horizons starting within 90 cm of the soil surface. |
19.1.2 Classifying perched profiles
Soil profiles sometimes exhibit perching behaviour, where a zone of more intense reduction in the subsoil exists directly above a low-permeability layer that appears to be less intensely reduced. These must be treated the same as any other soil profile when classifying. The depth to the shallowest hoorizon exhibiting the effects of impeded drainage, as defined by assessment of horizon reduction intensity in Table 19.1, is used to determine the profile drainage class. Treat Table 19.2 as a key, stopping at the first class that fits the profile.
For example: Consider the sequence Ap (0–15 cm) over Bg (15–35 cm) over B(g)x (35–65 cm) over BC(g)(x) (65–95 cm). In this soil profile the Bg horizon meets the strongly anaerobic criteria in Table 19.1, and because this horizon occurs <30 cm from the soil surface the soil profile is classified as poorly drained (PO) following criteria in Table 19.2.
19.1.3 Assessing redox intensity in mineral topsoils
Morphological features associated with anaerobic conditions can be hard to observe accurately in mineral topsoils (A horizons). A horizons are usually darkened by organic matter accumulation and so may be low-chroma without necessarily being subject to reduction.
General principles for assessing the reduction intensity of an A horizon are as follows.
- ‘A’ horizons that are darkened (e.g. 10YR 3/3 ) but that do not have low-chroma matrix colours should be considered aerobic.
- ‘A’ horizons that do have a low-chroma matrix but otherwise meet the criteria for ‘distinct topsoils’ in the New Zealand Soil Classification (i.e. visibly darker than the subsoil and at least 5 cm thick) should be considered to be subject to less intense reduction than the horizon immediately underneath. For example, a 15 cm thick Ap horizon with moderate structure over a Bw(f) horizon would be considered aerobic, while an Ap immediately over a B(g) would be considered slightly anaerobic. The degree of underlying reduction in the latter case suggests that some limited periods of wetness should occur in the overlying topsoil.
- Other weakly developed or very thin A horizons should usually be considered to have the same degree of redox intensity as the horizon below.
- Apg horizons, with their identifiable redox segregations, must be considered to be moderately anaerobic under the majority of circumstances.
- If an Apg horizon has a slightly peaty texture with weak or massive apedal structure, or clearly identifiable gley colour patterns, it can be considered strongly anaerobic.
Some caution should be exercised when assessing topsoils in agricultural landscapes. In some cases, topsoil redox segregations form in response to surface compaction from stock pugging, vehicle traffic, or tillage under wet conditions, while the deeper profile remains relatively unaffected. Clear description of the soil surface (Chapter 10) will help prevent the presence of a management-induced Apg horizon from inappropriately downgrading profile drainage in this situation.
19.1.4 Assessing redox intensity in mixed transitional horizons
For transitional A/B horizons, if the A horizon component is sub-dominant by volume, then it should simply be ignored for the assessment of redox intensity.
For example: in an A/B horizon where earthworm activity has moved dark A horizon material down through vertical burrows that occupy about 25% of the cut face of the soil horizon, the infilled burrows should not contribute to the total percentage of low-chroma colours in the soil matrix. The horizon would be assessed as if it were an unmixed B. In this case a transition horizon with 25% A horizon material and 75% subsoil material that classifies as a Bg horizon would classify in Table 19.1 as a strongly anaerobic horizon.
Where the A horizon material occupies the majority of the transitional zone, it can no longer be ignored. The topsoil component of the horizon should be assessed using the instructions in Section 19.1.3. The topsoil component will usually determine the overall redox intensity of the horizon, unless it classifies as more intensely reduced than the subsoil. In this case, use the intensity of the subsoil component.
For example: in an Ap/B(g) horizon where tillage has partially mixed the topsoil and subsoil and about 30% of the horizon comprises subsoil material, the horizon would classify per Table 19.1 as slightly anaerobic. An Apg/B(g) with a similar proportional mix would classify as moderately anaerobic, but never strongly anaerobic.
19.1.5 Assessing redox intensity in low-chroma parent materials
Exercise caution when assigning redox suffixes to soil horizons dominated by mafic/intermediate parent materials (e.g. basalt, andesite, see Section 4.2) because their colour usually appears darker than that of felsic parent materials (i.e. low-chroma and low-value) due to their mineralogy. Consequently, low-chroma colours appear less distinct.
Other soil parent materials can have low-chroma colours when relatively unweathered (e.g. young pumice deposits, unweathered schist and greywacke sands, and marine-deposited sedimentary rocks). Heavily leached soil horizons (e.g. E horizons) will often be both high-value and low-chroma. Distinguishing the influence of drainage in these materials requires examining them under a range of drainage conditions to better understand their natural variability.
As well as becoming familiar with the range of parent material appearance, using field tests for reducing conditions (Section 17.6) can help increase the accuracy of horizon notation provided sufficient free iron (Fe2+) remains in the soil solution.
19.1.6 Natural vs artificial drainage
Profile drainage is often modified by human activity, and many of these modifications require ongoing maintenance. Use a code from Table 19.3 to indicate the degree of drainage modification.
For example, use IP A for a profile on low-lying plain that is located adjacent to a deep artificial drain.
| Code | Name | Description |
|---|---|---|
| N | Natural | No evidence of human impacts on the local drainage regime |
| M | Minor | Drainage regime passively altered (e.g. by conversion to or from forest), or ambiguous evidence of any human impacts beyond clearing |
| A | Major | Clear evidence of direct human alteration to the drainage regime (e.g. drain or dam construction adjacent to site, flow diversions, infill, levelling or contouring works, mole or tile drainage) |
19.1.7 Within-class drainage variability
Users of this handbook may sometimes wish to distinguish between soil profiles that have the same profile drainage class but a variable expression of reduction depth and intensity within the class limits. For example, for a deep-rooted, wetness-intolerant crop, there is a difference between an imperfectly drained profile that is at its worst moderately reduced throughout the top 90 cm, and one that has strong or intense reduction at depth.
Within-class distinctions can be highlighted by appending the most intense redox class observed within the profile.
For example, use IP(v) for an imperfectly drained profile that is intensely anaerobic deep in the profile, vs IP(i) for an imperfectly drained profile where the redox intensity does not exceed moderate.
19.2 Permeability
Permeability is the measured or estimated rate at which water moves through the soil under ‘free-draining’ conditions (i.e. in the absence of barriers and in an unsaturated state). Permeability is assessed first on a per-horizon basis before the profile as a whole is summarised.
Permeability can be measured directly, and while these data are always preferred, the measurement process is time-consuming and labour intensive. As a result, a great deal of research effort has been directed towards developing reliable estimates of permeability for New Zealand soils based on soil morphology (McLaughlin and Watt 1989; Griffiths 1991; Webb and Lilburne 2011). This section describes a method of permeability estimation based on that work.
19.2.1 Horizon permeability
For each horizon, in the absence of direct measurements use texture group, structure, stone content, organic matter content, and unconfined strength at field condition to rate permeability using the characteristics described in Table 19.4.
Note that for each permeability class, topsoil horizons and soils with tephric parent materials are generally considered to be one class more permeable than described (e.g. a clayey topsoil horizon with <20 mm peds would be assigned moderate rather than moderately slow permeability).
| Code | Name | Permeability | Description |
|---|---|---|---|
| xs | Extremely slow | <0.1 mm/h |
|
| s | Slow | ≥0.1 to <4 mm/h |
|
| ms | Moderately slow | ≥4 to <18 mm/h |
|
| m | Moderate | ≥18 to <72 mm/h |
|
| r | Rapid | ≥72 mm/h |
|
19.2.2 Profile permeability
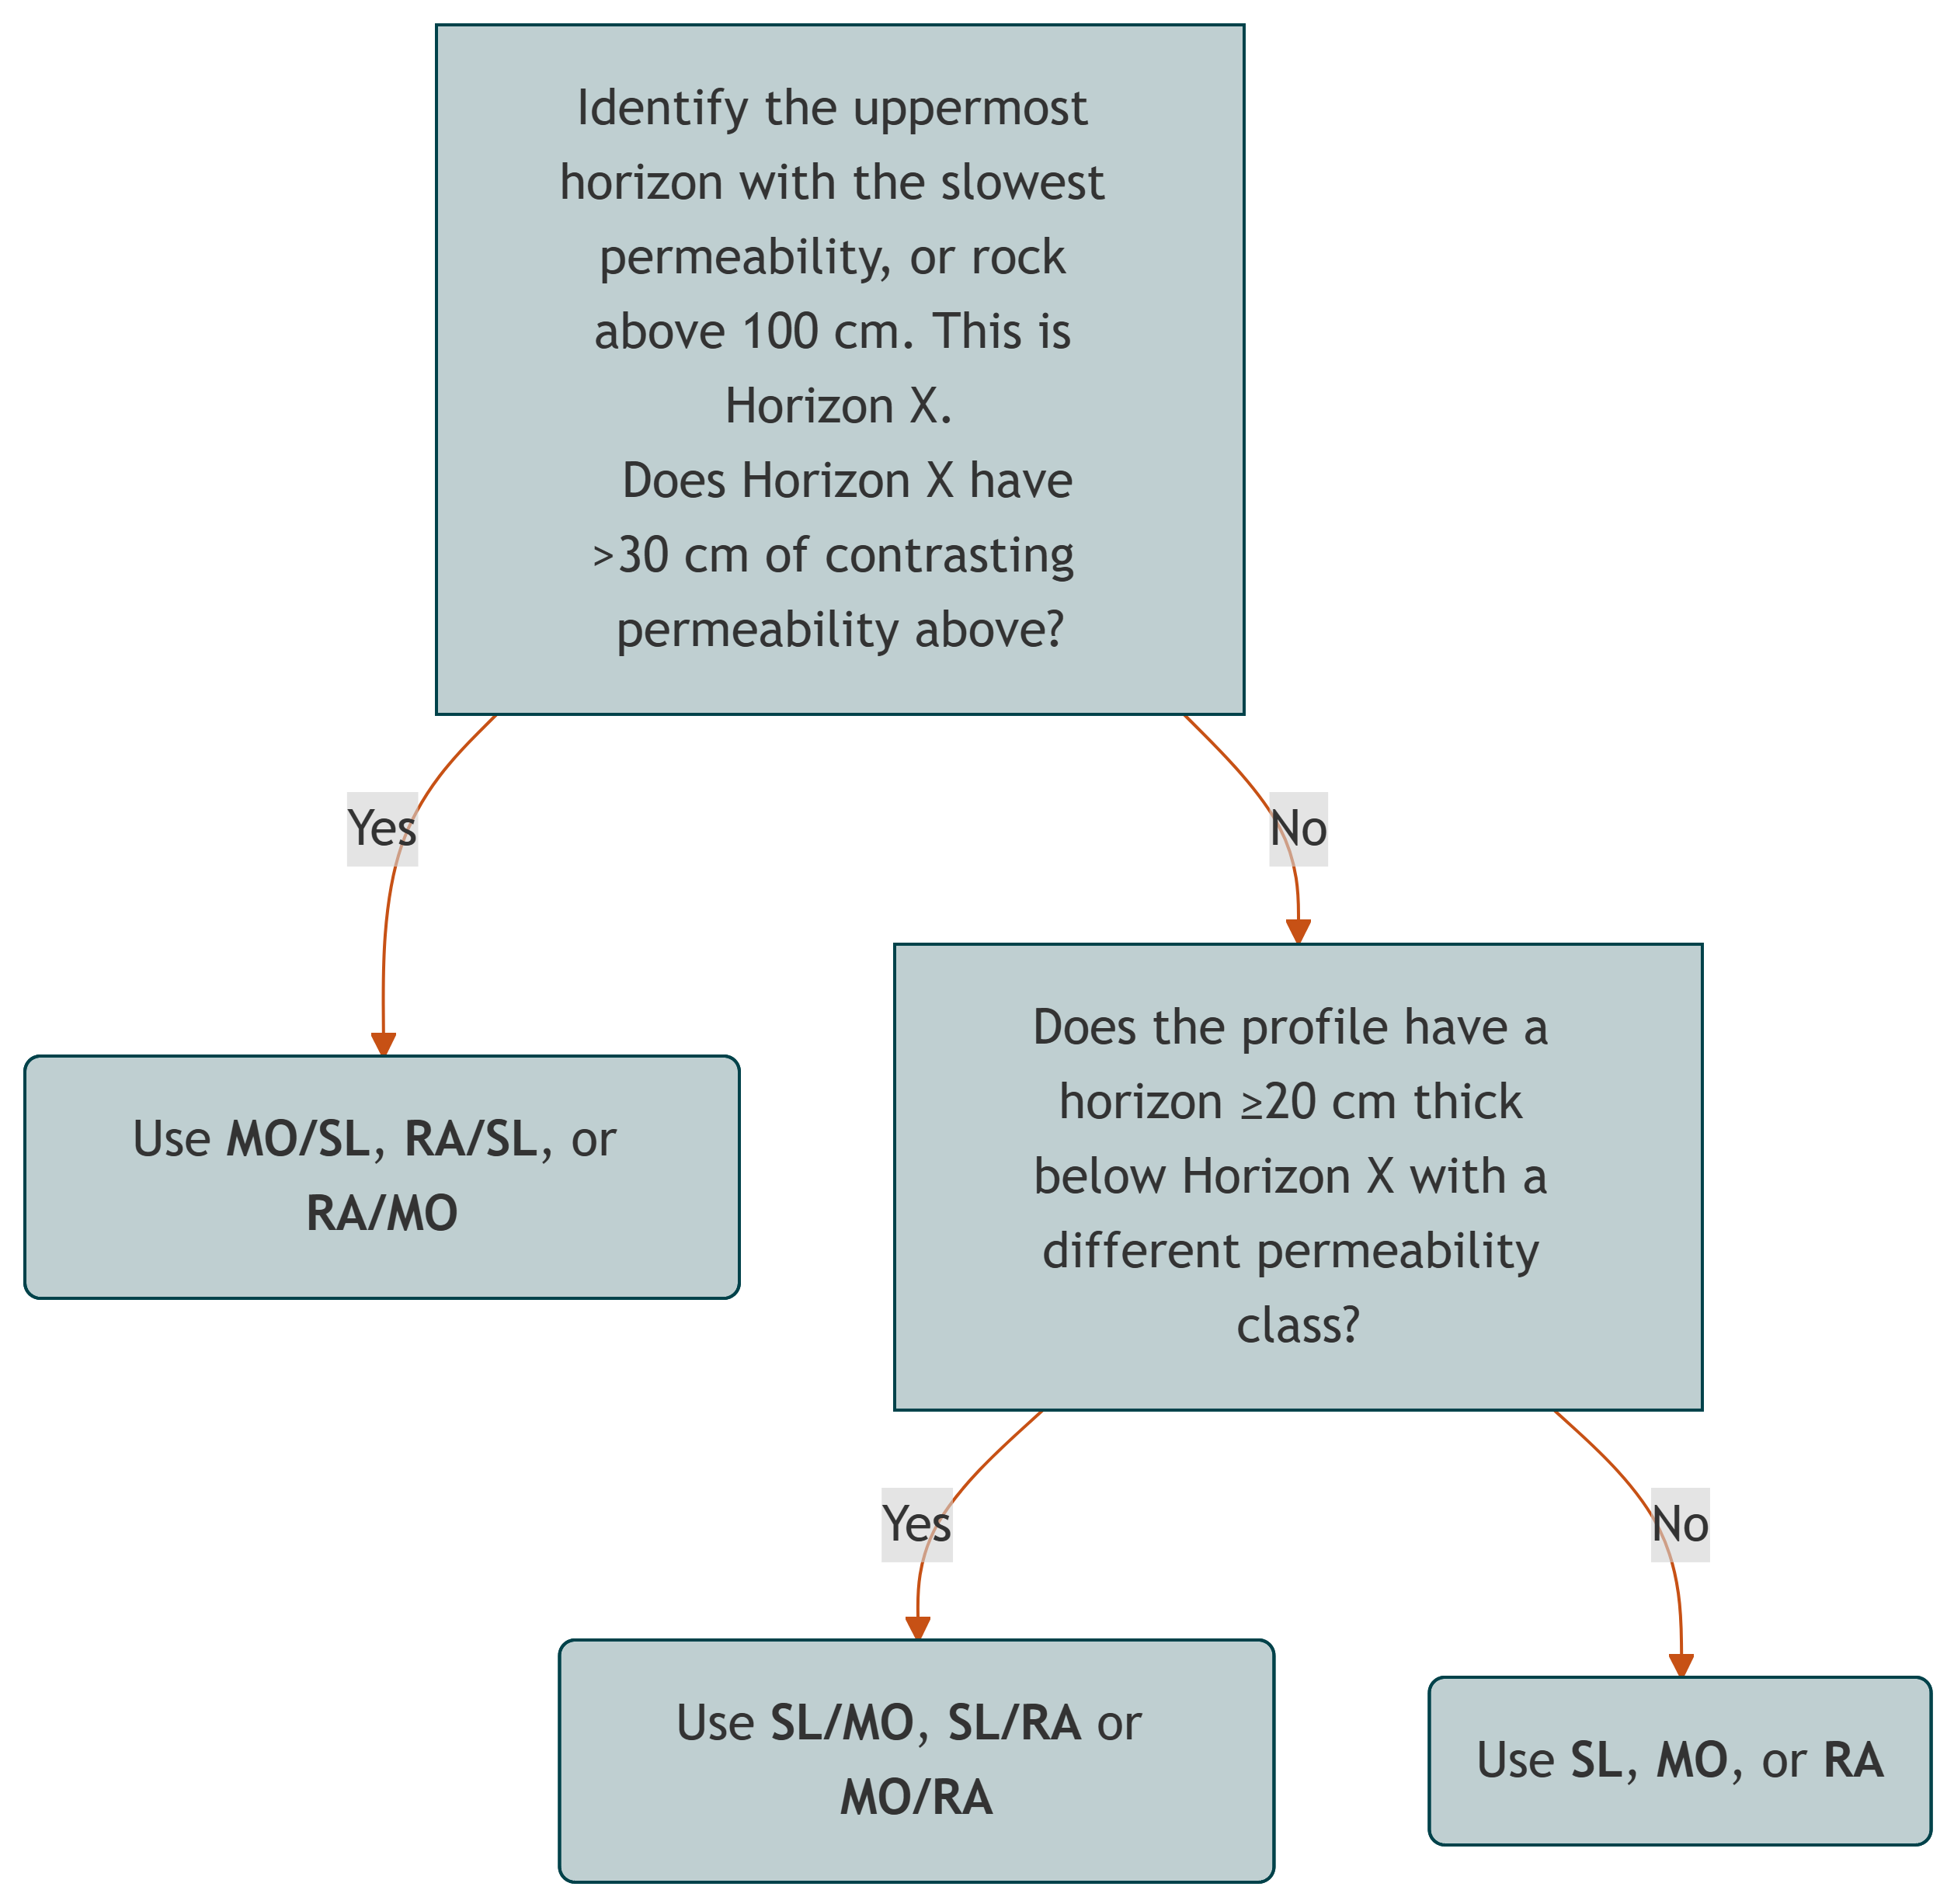
Summarising permeability at a profile level involves identifying the layer with the slowest permeability, and then identifying any significant deviations from that rating within the profile. First, simplify the horizon ratings according to Table 19.5, then follow Figure 19.1 to determine the profile permeability.
| Code | Name | Description | Horizon permeability class |
|---|---|---|---|
| SL | Slow | <4 mm/h | Extremely slow, slow |
| MO | Moderate | ≥4 to <72 mm/h | Moderately slow, moderate |
| RA | Rapid | ≥72 mm/h | Rapid |
19.3 Rooting depth restrictions
Some soils contain barriers to plant root growth that can affect some or all species, depending on the natural size of their root systems and their tolerance for particular conditions. Such barriers can include physical properties (soil firmness, buried rock or concrete), chemical properties (pH, salinity, macro- and micro-nutrient levels, presence of pollutants), biological properties (pathogens, pests), and hydrological properties (excessive wetness or dryness).
Rooting depth barriers can be identified most clearly by the behaviour of living roots in the profile. Absence of roots beyond a certain depth where vegetation is present at the surface may indicate a barrier, assuming the species present normally have a deep-rooting growth habit. Roots may also be observed to grow downwards until encountering a barrier and then turn to grow horizontally, sometimes forming subsurface mats. Root density may decrease suddenly at a horizon boundary without disappearing entirely, perhaps becoming sparse and confined to voids. Significant barriers may also affect the character of vegetation at the surface, causing for example, stunted growth.
Where rooting behaviour appears to be impaired, evidence of a likely cause can be inferred from the profile description, particularly:
- field tests for pH, salinity or reducing conditions (Chapter 17)
- strength, penetration resistance and induration tests (Chapter 16)
- structural characteristics, particularly the absence of peds or inter-ped spaces (Section 12.1)
- relative abundance of rock fragments, where excess rock might be a physical barrier and also limit water retention and movement (Section 12.2)
- soil texture, where high clay content may cause waterlogging or high sand content may limit water retention (Chapter 14)
- identification of pans blocking root growth, or concentrations that may suggest a chemical issue (Chapter 15).
Where these features are observed, in order to be considered as a potential rooting depth barrier their occurrence must usually coincide with the zone where root behaviour changes or roots disappear. Only a few barriers (e.g. bedrock) can be considered definite regardless of whether any roots are actually present in the profile. Where no obvious restricting features are present but impeded root growth is still observable, laboratory testing may be required to investigate the cause.
Record rooting barrier information as type using Table 19.6 and depth encountered in cm.
For example: use Bm 30 cm for a shallow profile over bedrock.
Rooting depths should usually coincide with a horizon boundary.
| Code | Name | Description |
|---|---|---|
| Ac | Acid | pH below 5.5 |
| Ak | Alkaline | pH above 8.0 |
| Na | Saline | EC above 0.6 dS/cm |
| Ax | Anoxic | Presence of reduced iron, or a very poor horizon drainage rating |
| Tx | Toxic | Presence of a human-made pollutant at levels affecting plant growth |
| Nx | Nutrient | Lack of a macro- or micro-nutrient required for plant growth |
| Fm | Firm | Unconfined soil strength firm or greater |
| Pp | Physical pan | Presence of a well-developed densipan or fragipan, or a compacted layer caused by cultivation, livestock trampling, or machinery traffic |
| Pc | Chemical pan | Presence of a well-developed chemical pan (e.g. duripan, iron-pan, calcrete) |
| Sk | Sandy | Soil texture is coarse sandy or sandy-skeletal with loose packing |
| Cl | Clayey | Soil texture is clayey and structure is apedal massive |
| Rk | Profile rock | Rock fragments occupy over 35% of the horizon by volume, either in the soil or in regolithic material |
| Ar | Artefact | A buried layer of anthropogenic origin is present (e.g. geofabric) |
| Bf | Fractured substrate | Saprolithic, paralithic or lithic material with notable cracking is present |
| Bm | Massive substrate | Paralithic or lithic material with no or minimal cracking is present |