| Code | Name | Description |
|---|---|---|
| C | Clayey | Comprised largely of mineral particles <0.002 mm |
| Z | Silty | Comprised largely of mineral particles ≥0.002–<0.06 mm |
| S | Sandy | Comprised largely of mineral particles ≥0.06–<2.0 mm |
| L | Loamy | Comprising a mixture of mineral particles <2.0 mm |
14 Texture
A great deal of soil physical and chemical behaviour is dependant on the particle size distribution within the solid fraction - the relative dominance of particular sizes, as well as the total size range present. This includes both mineral and organic matter. In the field, particle size distribution is estimated on a per-horizon basis using a combination of visual examination and hand manipulation under moist conditions.
The true particle size distribution is continuous, and open-ended. For ease of communication, particle size distribution is divided into set ranges, the broadest of which are the fine earth (<2 mm) and coarse mineral (≥2 mm, ‘rock fragments’) fractions. Within the fine-earth fraction, three fractions are defined - sand (<2.0–≥0.06 mm), silt (<0.06–≥0.002 mm) and clay (<0.002 mm). Organic matter is treated slightly differently, in that it can’t be separated easily from the soil mass in the field, and its particle size is less important than other characteristics (see Section 14.1.3). Field estimates of particle size distribution are commonly referred to as ‘soil texture’.
14.1 Describing texture components
14.1.1 Fine earth materials
The composition of the fine earth mineral fraction is assessed separately to that of larger rock fragments for practical reasons - not least because rock fragments are not always present. The fine fraction is assessed in the field by removing any rock fragments present by picking or sieving, and then manipulating the remaining sample in a moist state (see Section 11.6).
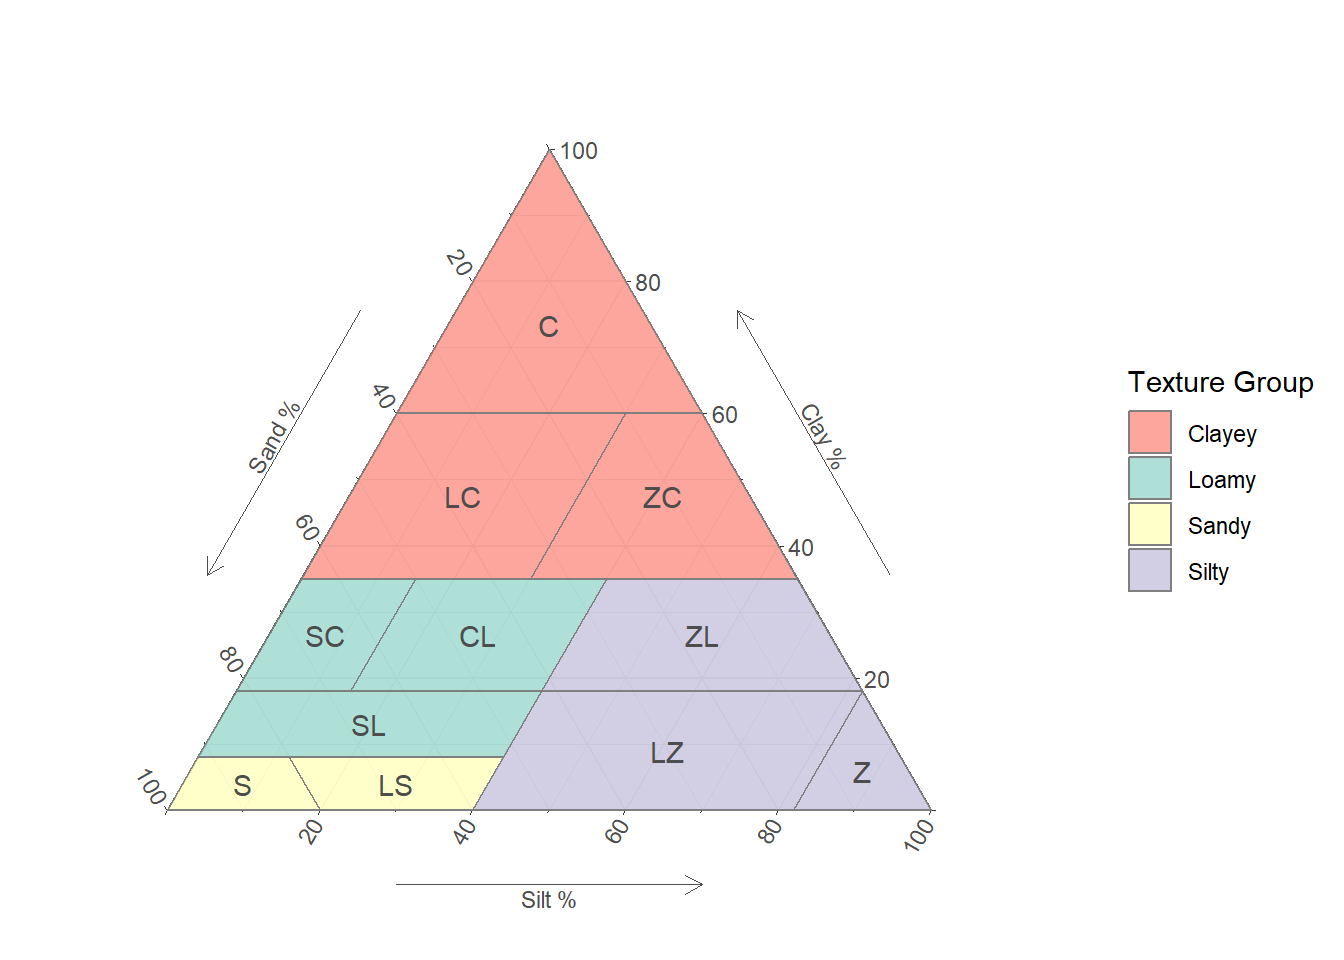
The New Zealand soil texture triangle is organised in two levels. At the broadest level, there are four major texture groups (clayey, silty, sandy, loamy), defined in Table 14.2. Within these groups, there are eleven recognised texture classes, which are the categories most commonly used in description and interpretation. The texture classes are most easily visualised on a ternary diagram, as seen in Figure 14.1. The range limits for each class are given in Table 14.3.
These divisions can reflect significant changes in measurable properties like hydraulic conductivity, but it is important to note that there are no sudden and obvious changes in hand-feel or visual appearance at each boundary.
| Code | Name | Clay range | Silt range | Sand range | |
|---|---|---|---|---|---|
| Sandy | SS | Sand | <8% | <20% | ≥80% |
| LS | Loamy Sand | <8% | ≥12–<40% | ≥52–<80% | |
| Loamy | SL | Sandy Loam | ≥8–<18% | <40% | ≥42–<92% |
| SC | Sandy Clay Loam | ≥18–<35% | <15% | ≥50–<82% | |
| CL | Clay Loam | ≥18–<35% | ≥15–<40% | ≥25–<67% | |
| Silty | LZ | Loamy Silt | <18% | ≥40–<82% | <60% |
| ZZ | Silt | <18% | ≥82% | <18% | |
| ZL | Silt Loam | ≥18–<35% | ≥40–<82% | <42% | |
| Clayey | LC | Loamy Clay | ≥35–<60% | <30% | ≥10–<65% |
| ZC | Silty Clay | ≥35–<60% | ≥30–<65% | <35% | |
| CC | Clay | ≥60% | <40% | <40% |
14.1.1.1 Sand fraction modifiers
The loamy and sandy texture classes in Table 14.3 can optionally be accompanied by additional information about the sand fraction. These codes, listed in Table 14.4, can be appended to a texture class as a prefix, e.g. KLS for coarse loamy sand. Only use a modifier when confident that ≥ 50% of the sand fraction will fall into the modifier’s size range.
| Code | Name | Description |
|---|---|---|
| F | Fine | Sand is dominantly ≥0.06–<0.2 mm |
| M | Medium | Sand is dominantly ≥0.2–<0.6 mm |
| K | Coarse | Sand is dominantly ≥0.6–<2.0 mm |
Subdivisions in the silt fraction can be determined in the laboratory but cannot be reliably detected by hand, and so are not included here.
14.1.2 Rock fragments
Where total rock fragments occupy more than 5% of the total horizon volume, their presence should be signified in the texture code. Choose the code from Table 14.5 that describes the majority of the fragments, and apply it using the conventions in Table 14.6.
| Code | Name | Description |
|---|---|---|
| G | Gravelly | Mineral particles ≥2–<60 mm |
| C | Cobbly | Mineral particles ≥60–<200 mm |
| B | Bouldery | Mineral particles ≥200 mm |
| Percent | Convention | Example | |
|---|---|---|---|
| <5% | Do not append | CL | clay loam with ~2% gravel |
| ≥5–<35% | Append as suffix | CL(G) | clay loam with ~10% gravel |
| ≥35–<70% | Append as prefix | (G)CL | clay loam with ~50% gravel |
| ≥70% | Use as primary code | G | clean gravel |
There is no upper size limit for the ‘Bouldery’ class, but in practice rocks larger than the profile are either recorded as (effectively) the bedrock (see Section 9.2.8.1, Section 18.1) or as surface features (see Section 10.3) depending on their position.
If a horizon has >70% rock fragments and >5% fine earth, mineral texture codes can still be appended as a suffix, e.g. G(ZL) for a gravel with some interstitial silt loam.
When recording texture for a mixed fine-earth/organic horizon containing rock fragments, record the rock fragment modifier before the organic modifier, separated by a comma, e.g. SL(G, H) for a sandy loam with gravel and humus, or (G, H)SL for a gravelly, humic sandy loam.
For poorly sorted horizons where a single fraction does not dominate the particle size distribution of rock fragments, choose the largest rock fragment code for recording. Determine abundance from the total percentage of rock fragments. For example, in a silt loam horizon with 15% gravel, 15% cobble and 10% boulder, use (C)ZL (total rock fragments 40%, largest co-dominant fraction cobble).
The rock fragment component of soils is sometimes referred to as the ‘soil skeleton’, and horizons with >35% rock fragments are sometimes called ‘skeletal’. This nomenclature can be modified with reference to the fine-earth fraction texture group, e.g. ‘sandy-skeletal’.
Conventions for describing rock fragment abundance, size, shape, lithology and distribution are outlined in Section 12.2.1.
14.1.2.1 Gravel fraction modifiers
The gravel fraction can optionally be subdivided into fine, medium and coarse gravel, much like the sand fraction (see Section 14.1.1.1). These codes, listed in Table 14.7, can be appended to the G code as a prefix e.g. KG for coarse gravel. Only use a modifier when confident that ≥50% of the gravel fraction will fall into the modifier’s size range.
| Code | Name | Description |
|---|---|---|
| F | Fine | Gravel is dominantly ≥2–<6 mm |
| M | Medium | Gravel is dominantly ≥6–<20 mm |
| K | Coarse | Gravel is dominantly ≥20–<60 mm |
Similar subdivisions are not considered useful for the cobble or boulder fractions.
14.1.3 Organic materials
Where organic materials occupy more than 17% of the fine earth fraction by volume, their presence should be signified in the texture code. Use either the H Humose or P Peaty codes from Table 14.8, choosing the code that describes the majority of the organic material, and apply it using the conventions in Table 14.9.
| Code | Name | Description |
|---|---|---|
| H | Humose | Comprises organic matter decomposing under aerated conditions |
| P | Peaty | Comprises organic matter decomposing under saturated conditions |
| Percent | Convention | Example | |
|---|---|---|---|
| <17% | Do not append | CL | clay loam with little organic material |
| ≥17–<30% | Append as suffix | CL(P) | clay loam with ~20% peaty organic material |
| ≥30–<50% | Append as prefix | (P)CL | clay loam with ~40% peaty organic material |
| ≥50% | Use as primary code | P | peat with little to no mineral material |
If a horizon has ≥ 50% organic material and > 5% mineral material, mineral codes can still be appended as a suffix, e.g. H(ZL) for a forest litter layer containing some fine mineral material, or P(G) for a peat with some volcanic lapilli present.
More precise field estimates of organic matter content within the ranges in Table 14.6 are unlikely to be accurate; direct measurement of SOC paired with bulk density is preferred.
14.1.3.1 Organic material modifiers
If more detail is desired, organic material decomposition and origin can also be appended using Table 14.10 and Table 14.11, e.g. PHU for a well-decomposed humic peat where the contributing plant species cannot be clearly identified.
Note that degree of decomposition is roughly analogous to the coarse/medium/fine subdivisions seen in the mineral fraction, but without strict size limits.
| Code | Name | Description |
|---|---|---|
| F | Fibric | Organic matter weakly decomposed and dominated by visible plant remains |
| M | Mesic | Organic matter moderately decomposed, some visible plant structures but mostly amorphous |
| H | Humic | Plant remains no longer identifiable, minimal fibre content |
| Code | Name | Description |
|---|---|---|
| M | Moss | Organic materials dominantly derived from moss species e.g. Sphagnum spp. |
| L | Plants | Organic materials dominantly derived from non-woody plants like grasses, sedges, rushes e.g., Empodisma spp. |
| T | Tree | Organic materials dominantly derived from woody vascular plants, e.g. Manoao/Silver Pine, Manoao colesnoi |
| U | Unknown | Origin of organic materials cannot be identified with confidence |
14.2 Method: Estimating soil texture by hand
The following method is recommended for use in the field. The method can also be used on fresh soil from representative bagged samples if field time is limited. Oven-dried samples should not be used to determine field texture, as some soil minerals clump together when heated and cannot be re-dispersed by hand.
- Collect a handful of soil material (no smaller than a ~30 mm block) from the target soil horizon, avoiding macrofeatures and boundary transition zones as much as possible.
- Pick or sieve to remove rock fragments and other coarse material.
- If the sample is not already moist, add small amounts of water while working the sample to bring its moisture content up. If the sample is too moist, work it in the hand until it dries. Additional soil might be required if too much water is added at once. A suitable moisture state is indicated when the sample feels moist to the touch but releases little, if any, water when squeezed.
- Continue working the sample in the hand until any structural units are broken down and the mixture is homogenised.
- Attempt to roll the sample into a ball. Can this be done easily? Does the ball hold together, or break apart under gentle pressure?
- If a ball can be reliably formed, compress the ball between thumb and forefinger. How much force is required to compress the ball by half? Does the ball crack, or keep a smooth outer surface?
- Check the look and feel of the ball. Does it feel gritty, floury, or buttery? Is it easy to mould and reshape? Can it be polished to a shiny surface?
- Attempt to form a ribbon ~5–10 mm wide and ~3 mm thick, by extruding the sample between the thumb and the side of the forefinger. Can a ribbon be formed without smearing or breaking? If so, how long a ribbon can be generated?
With these characteristics established, a texture class should be identifiable from the list in Table 14.12.
| Code | Name | Features | |
|---|---|---|---|
| Sandy | SS | Sand | Dominated by visible grains. Cannot form a persistent ball under moist conditions. Working the sample leaves no clay stain on hands. Cannot form a ribbon. |
| LS | Loamy Sand | Dominated by visible grains. May hold a very weak ball if carefully handled. Working the sample may leave a clay stain on hands. Cannot form a ribbon. | |
| Loamy | SL | Sandy Loam | Visible grains in a matrix of finer material. Feels gritty to the touch. Can form a weak ball and a short ribbon (<~25 mm). |
| SC | Sandy Clay Loam | Visible grains in a matrix of finer material. Feels gritty to the touch. Can form a coherent ball and a short ribbon (<~25 mm). | |
| CL | Clay Loam | Some visible grains but mostly finer material. Feels slightly gritty to the touch. Can form a coherent ball that will crack when compressed. Will form a ribbon of ~25–50 mm length. | |
| Silty | LZ | Loamy Silt | Some visible grains but mostly finer material. Feels smooth or floury to the touch. Can form a weak ball but cannot easily form a ribbon. |
| ZZ | Silt | Fine material without visible grains. Feels smooth or floury to the touch. May form a weak ball but tends to smear rather than form a ribbon. | |
| ZL | Silty Loam | Fine material without visible grains. Feels smooth or floury to the touch. Can form a coherent ball that will usually crack when compressed. Will form a ribbon of ~25–50 mm length. | |
| Clayey | LC | Loamy Clay | Fine material with some appreciable grit. Forms a coherent, smooth ball that may be difficult to compress and tends not to crack. Can form a ribbon of >~50 mm length. |
| ZC | Silty Clay | Fine material without visible grains. Forms a coherent, very smooth ball that may be difficult to compress and tends not to crack. Can form a ribbon of >~50 mm length. | |
| CC | Clay | Fine material without visible grains. Forms a coherent, smooth ball that may be difficult to compress, but can compress without cracking. Can form a ribbon of >~50 mm length. |
14.3 Recording soil texture
For rapid assessment of texture:
- For the fine earth fraction, use one of the texture group codes in Table 14.2 per horizon.
- Where rock fragments need to be recorded, use the dominant rock fragment code in Table 14.5
- Where organic materials need to be recorded, use one of the options in Table 14.8.
- Do not use any further modifiers.
For routine assessment, record one of the texture class codes in Table 14.12 per horizon. Where further detail is required, apply the relevant modifiers as described in Section 14.1.
Example: a coarse sandy loam with fine gravel. Rapid: L(G), Routine: KSL(FG)
14.4 Recording particle size distribution
Numerical estimates of particle size distribution for the fine earth fraction may be desired, particularly where it is known that laboratory particle size measurements will not be available. Record field estimates of clay and sand content derived from hand texturing to the nearest 1%, and work silt out by difference. It is recommended to add a separate error estimate (± x%) as an expression of confidence.
Example: KLS, 70 ± 5% sand, 3% clay for a coarse loamy sand.
14.4.1 Recording whole-soil particle size estimates
Percentage estimates of particle size require some adjustment when reporting on a whole-soil basis. Total fine earth is the sum of the mineral fine earth and the organic matter. Clay, silt and sand percentage estimates are initially reported as a fraction of the mineral fine earth only, and organic matter as a fraction of the total fine earth. Rock fragments are reported as a percentage of the whole soil volume.
For a worked example, take a soil with 25% clay, 35% silt, 40% sand, 15% organic matter, and 15% cobble.
- The total coarse fraction is 15% of the soil volume
- The total fine fraction is 85% of the soil volume (\(100 - coarse fraction\))
- The organic fraction of the fine earth is then \(15\% \times 85\% = 12.75\%\)
- This leaves the mineral fraction of the fine earth as \(85\% - 12.75\% = 72.25\%\)
- Distributed between clay, sand and silt:
- clay \(25\% \times 72.25\% = 18.06\%\)
- silt \(35\% \times 72.25\% = 25.29\%\)
- sand \(40\% \times 72.25\% = 28.90\%\)
The final whole-earth composition is 18% clay, 25% silt, 29% sand, 15% cobble, and 13% organic matter.
Report the final results in whole percentages; the method in use can’t support any higher precision.
14.5 Whole-soil texture description statements
Plain-text descriptions of texture (or of laboratory-analysed particle size distribution) may be preferred in some cases, for example in teaching materials and long-form reporting. The coding system described above can be translated into plain text. Use the grammatical conventions in Table 14.13 to describe their relative dominance. For each abundance fraction, the dominant size class is mentioned in descending order.
| Fraction | Format |
Mineral
|
Organic
|
||
|---|---|---|---|---|---|
| % Abundance | Example | % Abundance | Example | ||
| Dominant | Term | ≥70% | Gravel | ≥50% | Peat |
| Major | Term(ly/y/ose) | ≥35% | Gravelly | ≥30% | Peaty |
| Minor | with (term) | ≥5% | with gravel | ≥17% | with peat |
For example, a horizon with a sandy loam fine earth texture of 60% sand, 25% silt, and 15% clay along with 10% cobble would be described at its very simplest as a “loam with cobble”, or in more detail as a “sandy loam with cobble”. If the cobble occupied 50% of the total solid volume it would be a “cobbly sandy loam”.